You've now been running A/B tests, evaluating them, and making useful business decisions for months. Because you're following the advice in A/B Testing Rigorously you're confident that you're actually making correct decisions. Life seems good. But then in a meeting:
Your boss asks, "So when can we wrap up that button test?
"It doesn't look like it will stop any time soon," you reply.
"I know," says your boss, "we've been running it for three months, it has over 10k conversions. We have other ideas to try, we need to kill that test."
"But," you say, "it is nowhere near significance. Stopping it is completely wrong under the procedure we're using, we'll have no idea whether we're making the right decision!"
Your boss snaps, "Doing 'the right decision' could easily take a million more conversions! If we knew how to get to a million conversions, we'd all be rich and wouldn't care about the color of the button! We'll declare the red button the winner, and you need to figure out a better way to stop the next test.
Clearly your boss has a point. Businesses need to be able to make decisions, and have a limited ability to collect data. But how can we say that in math? And what are the consequences if we do?
Previously we set a very high standard. We tried to limit how often we'd make a mistake, even under the null hypothesis that there is no difference between the versions. However if we always want to get an answer, then we're always going to have to give an answer. And that means that we're always going to get the null hypothesis wrong! This is even worse than what Evan Miller was complaining about in How Not To Run An A/B Test!
Can we possibly justify this kind of mistake?
Evan's article is based on statistics as used in medical research. Clearly a very high standard is appropriate there. For instance if you are studying whether eating grapefruit reduces cancer, a wrong claim that it does when it does not matter will result in a lot of people eating grapefruit. People will start selling concentrated grapefruit pills. Getting the null hypothesis wrong matters.
But we're running a website here. If we get the null hypothesis wrong, our button winds up a random color, we still make the same amount of money, and nobody would care if they knew. But nobody will know, because nobody's going to actually re-run the test. Getting the null hypothesis wrong here really doesn't matter.
So what kinds of errors do we actually care about? We care about the possibility that there is a significant conversion difference..and we get the answer backwards. Suppose that one version drives, say, $5\%$ more conversions than the other. With enough data, we'd hope that this bias would be obvious. So we at least have a shot of, with a fixed amount of data, correctly identifying this level of difference the vast majority of the time.
In short in our last procedure we had a standard that gave results of the form, "We're confident that we're not wrong.". Now we're hoping for results of the form, "We're confident that we didn't screw up too badly. (And hopefully we're right.)" We will worry about the relationship between "confident", "too badly", and the amount of data that we need to collect when we get there.
We will use the same basic setup that we used in the last article, including the same versions, conversion rates, etc.
Previously we paid little attention to the conversion differences because we were explicitly analyzing the null hypothesis. This time we need to pay attention to that difference. Therefore let's let $w$ be the "win" that version B has over version A. That is, $r_B = (1 + w)r_A$. (Of course $w$ could be negative, in which case B would be losing...) Substituting this into the equation that we had in the previous article we find that:
$$\begin{eqnarray} \text{Portion that are A} & = & \frac{1}{1 + \frac{r_B}{r_A}} \\ & = & \frac{1}{1 + \frac{(1 + w)r_A}{r_A}} \\ & = & \frac{1}{2 + w} \end{eqnarray}$$ And $$\begin{eqnarray} \text{Portion that are B} & = & 1 - \text{Portion that are A} \\ & = & 1 - \frac{1}{2 + w} \\ & = & \frac{2 + w}{2 + w} - \frac{1}{2 + w} \\ & = & \frac{1 + w}{2 + w} \end{eqnarray}$$
In the first article we found a workable procedure by running a simulation of the null hypothesis, with a cutoff rule that would always stay within the maximum error bound that we were willing to accept. We'd like to do something similar this time, but now our procedure will need to be designed to reliably detect some win $w$ with acceptably few errors, hopefully within the maximum number of conversions that we are willing to throw at the test.
Let us start with the distribution of errors. The best way to minimize mistakes from random fluctuations is to wait until we collect all of the conversions that we are willing to test. But what if one version is really bad? Businesses justifiably do not want to risk losing a lot of conversions in return for a small improvement in statistical certainty. Therefore we need to make early decisions, even though that creates the possibility of early mistakes.
The next simplest choice we could make is to spread our errors evenly. More precisely we'll have an error rate $\text{err}$ and at any point that we potentially make a decision we'll only add $\text{err}$ to our errors in our target scenario.
Obviously you would want to automate this calculation. So I wrote yet another program to make that easy. Here is a sample run (note, the large $n$ is a default cutoff that we do not expect to actually reach):
$ bin/find-fixed-conversion-limits --win 0.05 --error-rate 0.00002 --output procedure.txt
$VAR1 = {
  'n' => 1000000000,
  'win' => '0.05',
  'error_rate' => '0.00002',
  'errors' => '0.0449936124013646',
  'remaining_errors' => 0,
  'last_error' => '1.63301770741095e-05',
  'last_decision' => 6701,
  'right' => '0.955006387598635'
};
Using this, and scenarios with a win of $5\%$, here is a graph of the decision procedures that we'd generate for a win of $5\%$ and a variety of low error rates. (The error rates have to be very low, because they are the error rate per decision, and we want to get to an acceptable cumulative error rate after thousands of observations.):
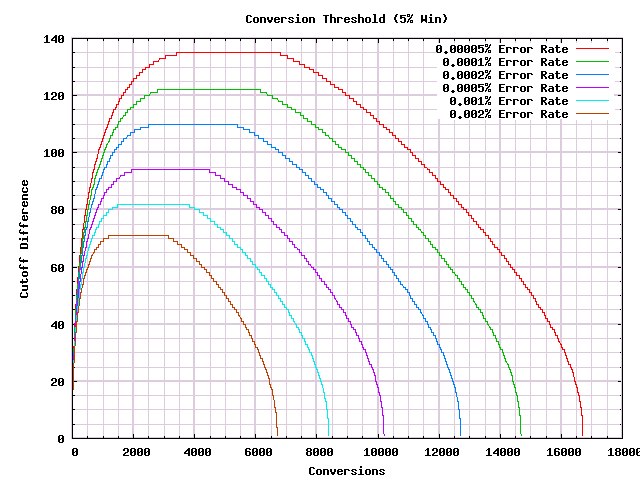
As we hoped, these rules guarantee a (possibly incorrect) answer after a finite number of conversions. There is clearly a connection between the error rate, the win, and the stopping point. Working this out analytically would be complicated, but we do not need to do that. We can just do a binary search to come up with decision procedures that stop at the desired place. Which capability I built into the previous program. So here are, for different error rates, the corresponding decision procedures that will stop by 10k conversions (actually they stop at 9,999 so that an exact tie is impossible). The underlying wins that are assumed in the scenarios are not shown:
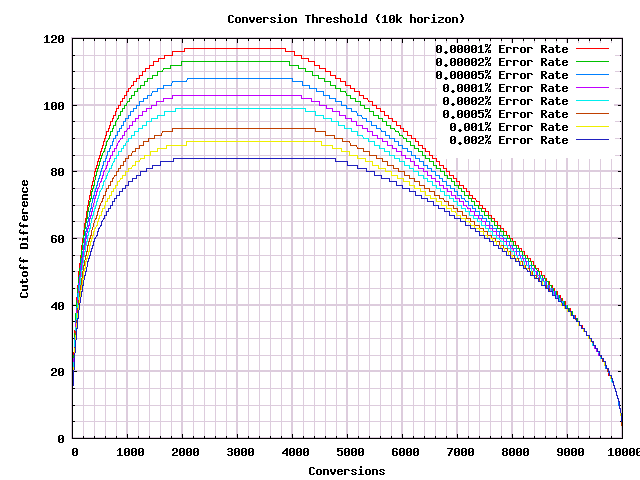
Each of these curves provides a reasonable trade off between making very few mistakes early on, and stopping the test as soon as it is clear which side of the dividing line we'll wind up on at 10k conversions. But we need to arbitrarily choose one. Because I dislike making too many preventable bad mistakes, I'll choose an error rate that makes $\text{threshold} * \text{error-rate} = 0.01$. In the above graph that is the a $\frac{0.01}{10000} = 0.000001 = 0.0001\%$ error rate.
Now that we have decided on an error rate based on the threshold, we can, for any cutoff threshold that we want, generate a decision procedure for our A/B test. Here is, on one graph, the procedures for many different cutoff thresholds.
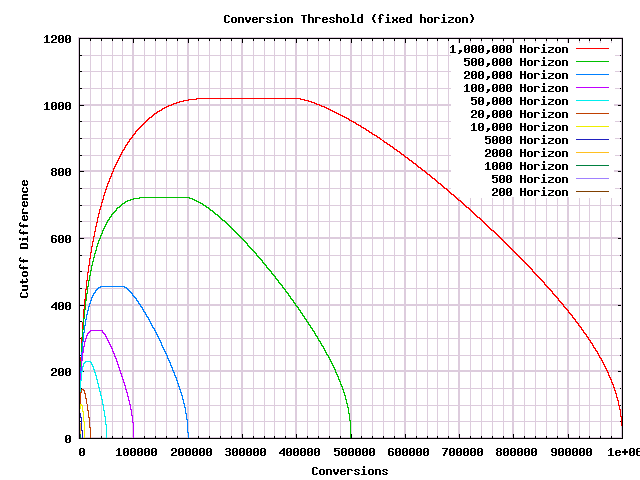
Now we can choose a threshold by which we want an answer, and come up with a reasonable A/B test procedure that will produce an answer by that point. But we can't easily see commonalities between the answers for different thresholds. To get that, we will need to scale the graph to pull that out. As a first step we can rescale the X-axis so that we see everything as a percentage of the distance to the threshold:
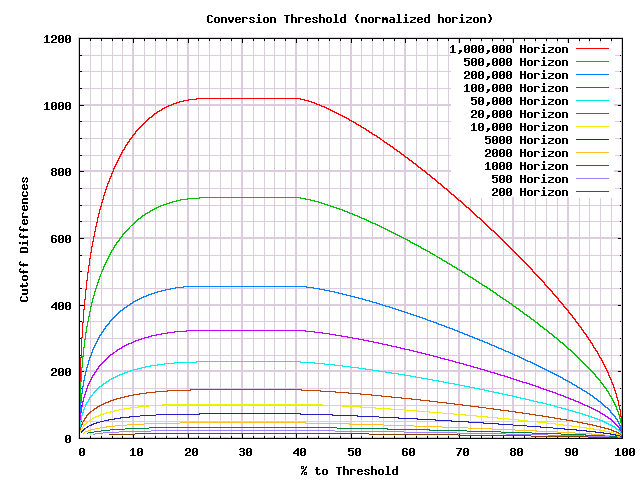
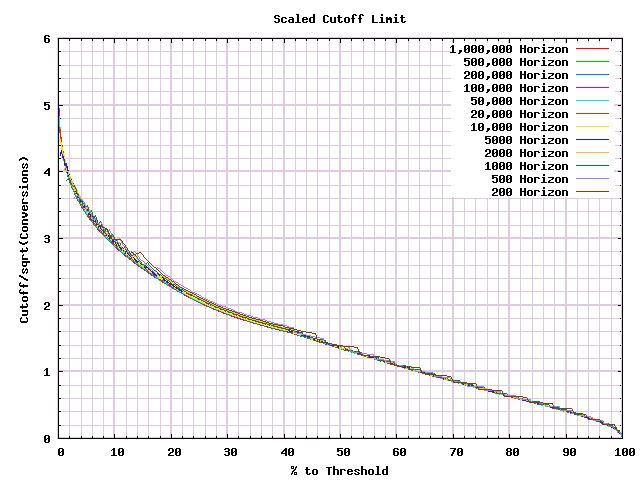
The shapes certainly are similar. Spot checking the tops of the first few curves, they seem to be around the square root of the limit we've set. So let's divide by that.
Under the discretization differences, we can see the underlying commonality in the shape. One of the most important details is that the maximum difference in conversions that we can make a decision at is just slightly over the square root of the threshold. It would not be inaccurate to call that the possible cost of running a test.
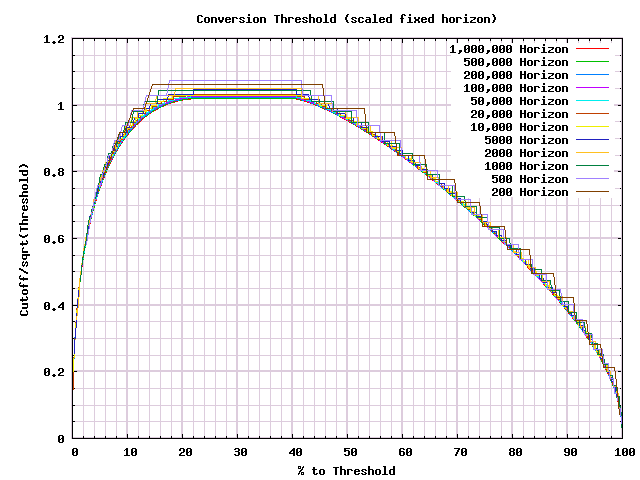
Unfortunately this form makes it hard to see exactly what is going on near the beginning of the test. In our previous article we had good luck in dividing by the square root of the number of conversions. Let's try that instead.
Much better. This gives us a usable idea of the relative behavior, even at the very start of a test. Which is exactly what we were looking for.
In the previous article, we found that once we had similar graph, we could calculate answers by hand. Now that we have a graph, we can try the same. First, since all curves are pretty close, let's use the smoothest one that we have as our "canonical curve".
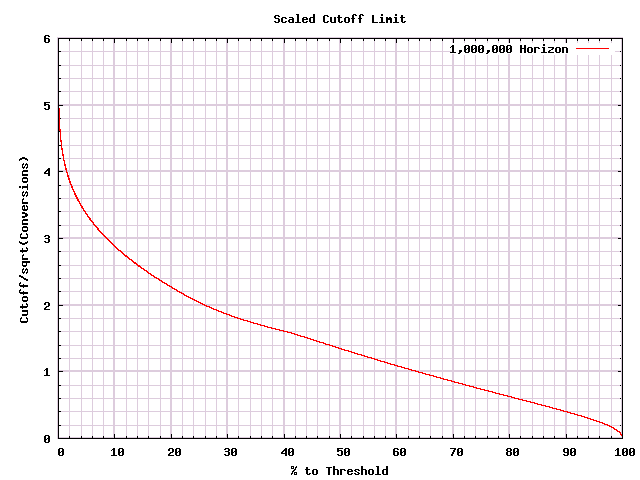
Using the same ZipRecruiter example as in the previous article, we had $316$ A conversions, and $417$ B conversions. As before the difference is $-101$, and the total is $733$, so on the Y-axis we are at $3.7305...$. Looking at the graph, that looks like we'll keep the test going if we're less than, perhaps, $2.5\%$ of the way along. Pulling out a calculator, $\frac{733}{0.025} = 29320 \approx 30000$. So if our desired threshold is over 30k conversions, we'd continue the test, otherwise we'd stop.
Now you may note that this procedure is sloppy - we might well be off slightly in drawing our boundaries. This is OK. We might be off slightly. But we'll be drawing the boundary pretty close to where we should. And the differences between the (arbitrary) procedure that we are trying to follow, and the one we actually follow, won't generally be material.
This is useful if you have raw conversion numbers and are willing to pull out a calculator. But what if you're using some A/B test tool that gives you a p-value by some standard statistical test? How do we convert in that case? Well my program recorded p-values for its cutoffs, and it gives us the following graph:
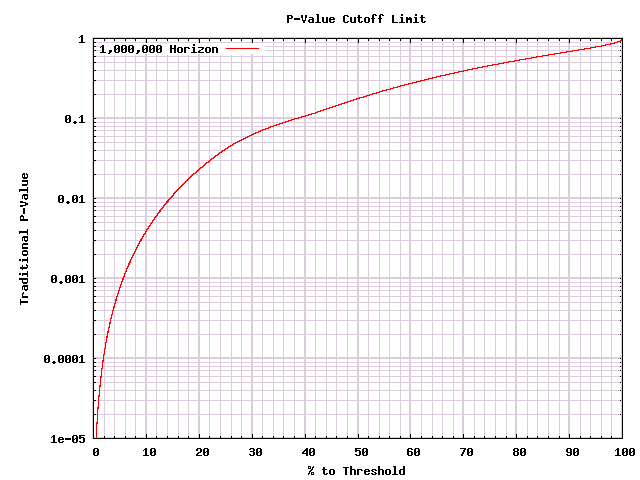
Now you can decide what percentage you are along the way to a decision (whether that limit is based on time, visitors, conversions - anything that you want), and you can look at the p-value versus that curve and decide whether to stop the test. If you already have an A/B test tool, this is the simplest way to go.
We decided up front that we would accept much worse errors than our previous procedure allowed. But before we can use it, we need to know whether the errors are acceptable. Using yet another program I can take the procedures that I generated earlier, and find the odds of calling the test wrong for a given real win. Here are the error rates that we find for our various procedures with real wins in the $0\%$ to $10\%$ range:
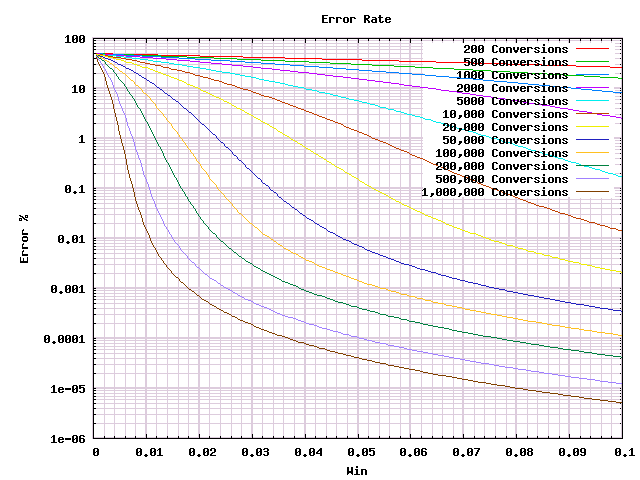
My honest impression? That's a lot of lines. And more conversions give you fewer errors. But I don't see much more there. However, as we saw above when we started rescaling, there is hope that there is a much simpler picture to be had. We had great luck before scaling with a square root factor, let's try that again.
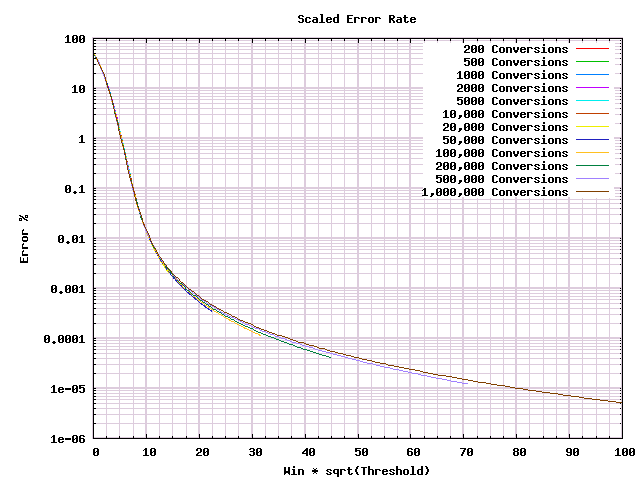
Much better! Now we just need to make one more change to learn what we really need to from it. Most of this graph is taken up with the fine details of when we have absurdly low odds of making mistakes. But we care only about the bit with reasonably high error probabilities.
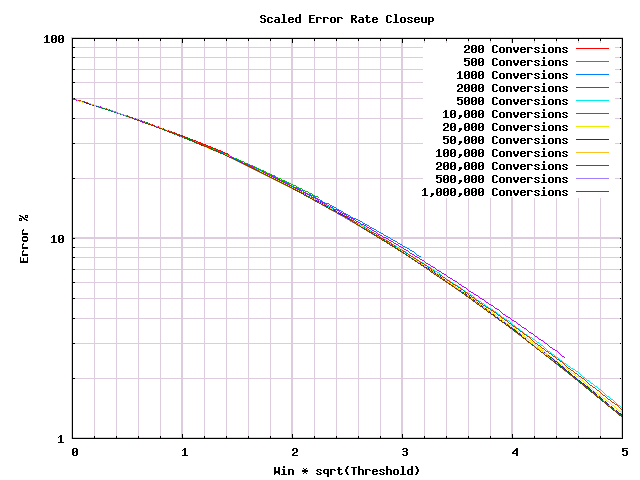
And here is what is useful to know. If $N$ is the number of conversions that is a limit to your test, then this graph is scaled so that $\frac{1}{\sqrt{N}}$ is 1. So with $10,000$ conversions the 1 represents $1\%$. With $1000$ conversions, 1 is about $3.2\%$. With $100$ conversions 1 is about $10\%$.
Below 1, it is a coin flip whether you get the right answer or the wrong one. At 2 on the graph, you're getting the right answer about $80\%$ of the time. At 3 you get it about $90\%$ of the time. At 4 you get it about $97\%$ of the time. Above 5 you're getting into the $99+\%$ confidence range.
Depending on your business, that potential for significant mistakes could be anywhere from very reasonable to shockingly horrible. If those errors are very reasonable, then I would highly encourage you to develop an A/B testing culture. If those errors are unacceptable, then either your organization either is not large enough for A/B testing, or does not realize the errors that it makes without knowing it. The solution to the latter problem is education. The former problem is intrinsically hard. Different statistical methods can be tried, but if they are valid then they won't give substantially different results. In the end you will have to follow best practices, and hope that your mistakes are acceptable.
Businesses need to be able to make decisions, and have a limited ability to collect data. You can reconcile these if you are willing to accept making small mistakes. After a series of reasonable assumptions, we came up with usable decision procedures. And were able to analyze what kinds of errors would be made.
If you're running a test and are willing to throw $N$ conversions at it, the procedure is likely to call it with a difference of about $\sqrt{n}$ conversions. In looking at error rates, we found that if the better version has a conversion rate that improves by less than a factor of $\frac{2}{\sqrt{N}}$ (ie a 2 on the graph above), you will often get the wrong answer. If the improvement is less than $\frac{4}{\sqrt{N}}$ then you still have fairly high error rates. If your business is unable to put enough conversions into tests to make those errors acceptable, then you're likely better off following accepted best practices and hoping for the best, rather than trying to depend on an overly cloudy A/B testing crystal ball. But make a note to revisit A/B testing after your business has grown to the point where it is feasible.
In the next installment in this series, I plan to show a very different way to analyze a similar tradeoff to this one, coming up with a remarkably simple answer. I also want to explore the extent to which the errors in this procedure can and cannot be improved on, and why traditional statistical tests really say something different from what most people think they say.
My thanks in chronological order to Kaitlyn Parkhurst, Nicole Tilly, Chris Sloan and Amy Price for feedback on various drafts. Without their help, this article would have been much worse. Any remaining mistakes should be emailed to Ben Tilly.
Further discussion of this article may be found on Hacker News.